Before I begin, it's important to note that ACA exchange enrollment has dropped in Hawaii since Congressional Republicans allowed the enhanced federal subsidies to expire at the end of last year. Fortunately, the raw number of enrollees who have lost coverage is pretty small due to:
a) Hawaii only having around 1.4 million residents to begin with and
b) Hawaii having a much more robust Employer-Sponsored Health Insurance mandate law than the ACA. Under the Hawaii Prepaid Health Care Act of 1974, employers are required to offer coverage to employees working at least 20 hours per week. In contrast, the federal Patient Protection and Affordable Care Act requires employers to offer coverage to employees working at least 30 hours per week.
As a result, Hawaii's individual/nongroup health insurance market is smaller as a percentage of the total population than it is in most other states.
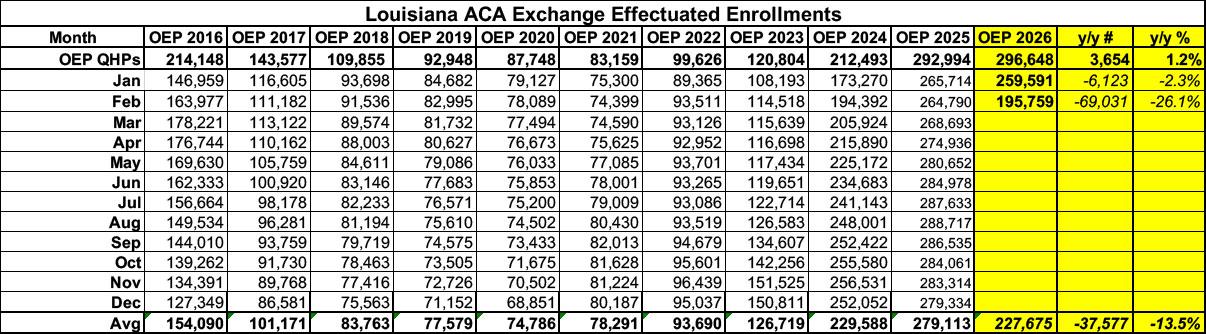
Before I begin, it's important to note that ACA exchange enrollment has plummeted in Louisiana since Congressional Republicans allowed the enhanced federal subsidies to expire at the end of last year.
Initial signups during the 2026 Open Enrollment Period were actually up slightly vs. OEP 2025...but actual effectuated enrollment was 2.3% lower as of January...and then fell off a cliff in February, with enrollment dropping a stunning 26% vs. a year earlier. That's over 69,000 Louisianans who were priced out of coverage in just the first two months of the year:
Here's what this looks like visually, with both 2025 and 2019 (the last pre-COVID year, which didn't include the enhanced subsidies) included for comparison:
Initial signups during Open Enrollment were only down about 2% vs. 2025..but effectuated enrollment began to drop immediately and has continued to drop every month since then.
As of June 2026, effectuated enrollment is down 8.4% vs. a year earlier, and is down 7.7% on average for the year so far. That's around 22,000 fewer Coloradans with ACA exchange coverage so far this year:
Recent federal changes are making it more difficult for Washingtonians to access and maintain health insurance. While hundreds of thousands rely on Washington Healthplanfinder to find and enroll in coverage, new federal policies will leave many residents at risk of losing the care they need.
We at Washington Health Benefit Exchange are still doing all we can to help residents get health and dental insurance, regardless of immigration status. However, due to H.R. 1 and new rules impacting marketplace coverage, there are changes regarding immigrant eligibility and how much people pay for health insurance.
As of October 1, 2025, people with Deferred Action for Childhood Arrivals (DACA) status no longer qualify for federal tax credits.
Before I begin, it's important to note that ACA exchange enrollment has dropped in Pennsylvania since Congressional Republicans allowed the enhanced federal subsidies to expire at the end of last year...although thanks to the state implementing fairly robust Premium Alignment pricing, it's not nearly as dramatic a drop-off as in most other states.
Initial signups during Open Enrollment were actually slightly higher than last year...but effectuated enrollment began to drop starting in February and has continued to drop at an increasing rate every month since then. As of July 2026, effectuated enrollment is down more than 10% vs. a year earlier, and it's down nearly 4% on average for the year so far. That's 48,000 fewer Pennsylvanians with ACA exchange coverage as of July:
Medicare Advantage (technically "Medicare Part C" & originally called "Medicare+Choice") is a type of health plan in the United States offered by private companies as part of the original Social Security Act of 1965 that created Medicare. It permits a private insurance option that wraps around traditional Medicare. Medicare Advantage plans attempt to fill some coverage gaps and offer alternative coverage options.
Under Part C, Medicare pays a plan operator a fixed payment for each enrollee. The operator then pays for their medical expenses. Traditional Medicare directly compensates providers on a fee-for-service basis. Plans are offered by integrated health delivery systems, labor unions, non profit charities, and health insurance companies, which may limit enrollment to specific groups of people (such as union members).
Last September, just ahead of the 2026 ACA Open Enrollment Period, the Colorado legislature passed emergency legislation to generate funding to backfill around 40% of the premium subsidies which were lost when Congressional Republicans refused to extend the enhanced federal tax credits:
DENVER - Colorado Insurance Commissioner Michael Conway released the following statement on Governor Polis signing HB 25B-1006 into law, legislation that provides funding to the individual healthcare market to reduce catastrophic premium increases:
“I’m grateful Colorado lawmakers heeded our call about catastrophic price increases for the individual healthcare market and passed a temporary fix this special session. This stopgap measure will provide crucial funding to reduce the rise in premium costs for working families. But without Congress stepping up to extend enhanced premium tax credits, tens of thousands of hardworking Coloradans will lose their healthcare, and those who remain enrolled can expect to see average net rate increases of more than 100%, and for many, almost 200%.”
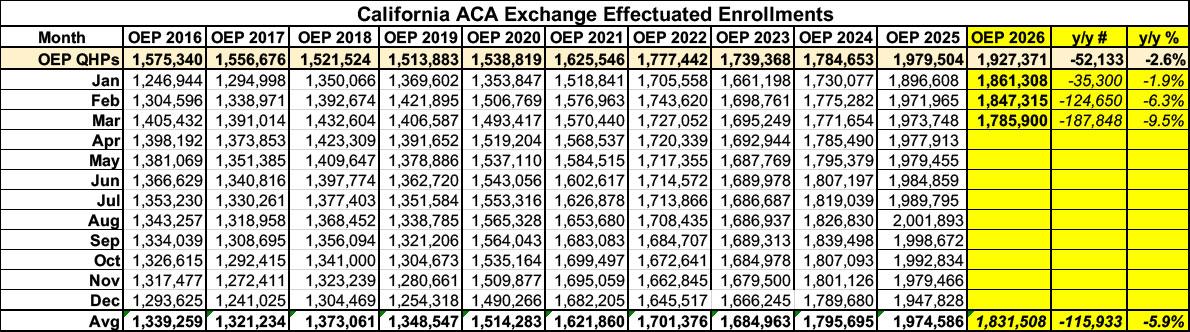
Before I begin, it's important to note that ACA exchange enrollment has dropped in California since Congressional Republicans allowed the enhanced federal subsidies to expire at the end of last year...although thanks to the state providing its own supplemental financial subsidies to partially cancel out the lost federal subsidies, it's not nearly as dramatic a drop-off as in most other states.
Effectuated enrollment was down 9.5% year over year as of March, and has almost certainly continued to drop further since then based on the trend line (see below). That's at least 187,000 fewer Californians enrolled in ACA healthcare coverage this year.
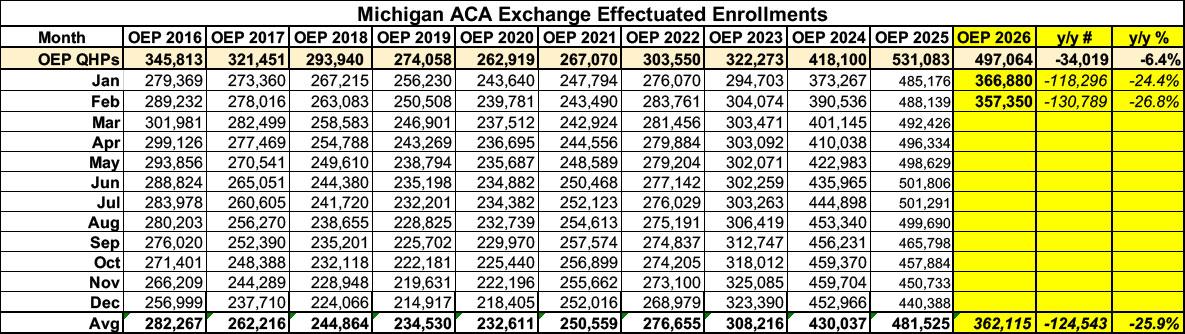
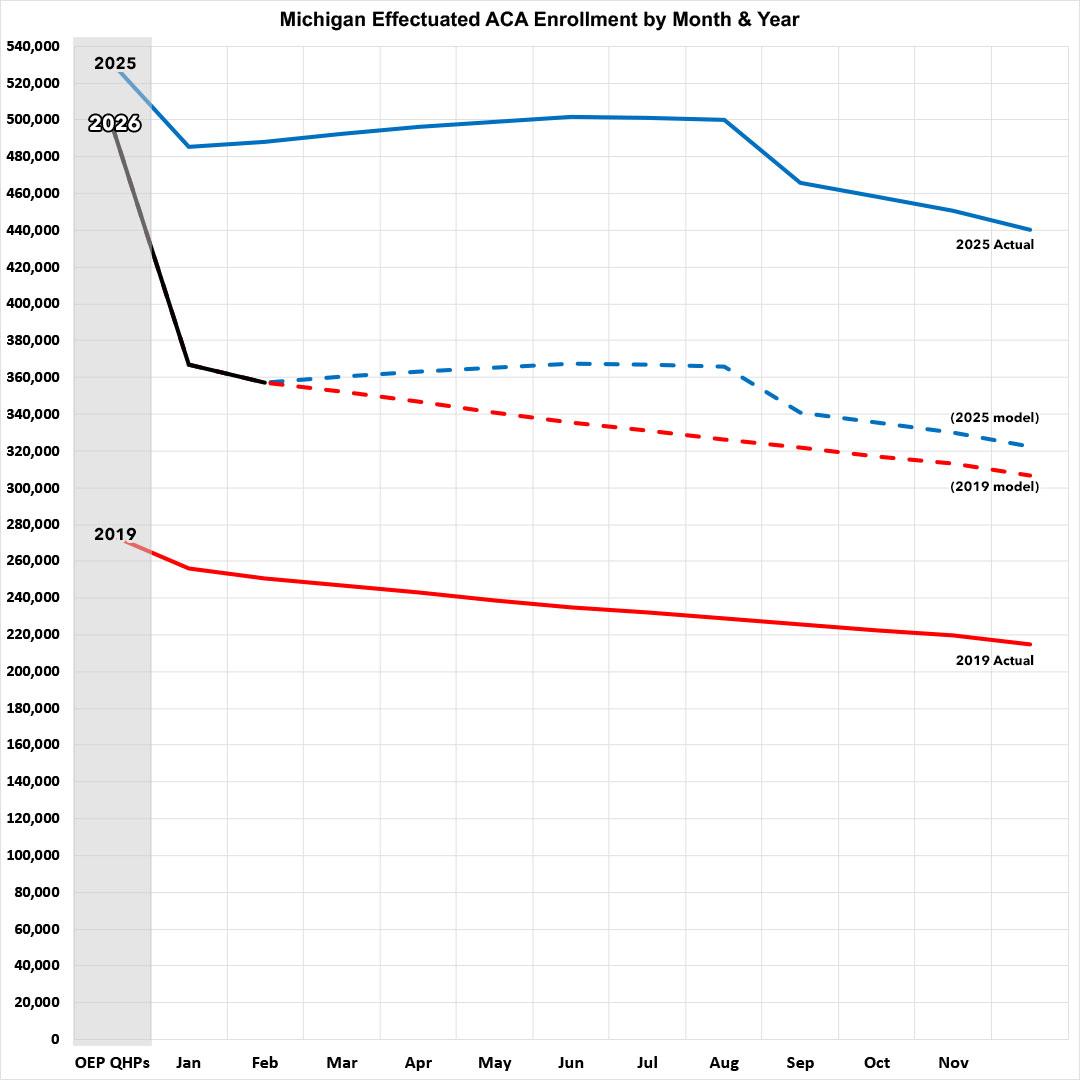
Before I begin, it's important to note that as in most states, ACA exchange enrollment has plummeted in Michigan since Congressional Republicans allowed the enhanced federal subsidies to expire at the end of last year: Effectuated enrollment was down 27% year over year as of February, and has almost certainly continued to drop further since then. That's at least 131,000 fewer Michiganders enrolled in ACA healthcare coverage this year.
Here's what this looks like visually, with both 2025 and 2019 (the last pre-COVID year, which didn't include the enhanced subsidies) included for comparison: