

Maryland: One of the few bright spots this year as effectuated enrollment is *up* 6% y/y...so far
Wed, 04/29/2026 - 6:22pm
Maryland Health Connection is one of the handful of states operating their own ACA exchanges which publishes effectuated enrollment data on a monthly basis, so let's take a look...
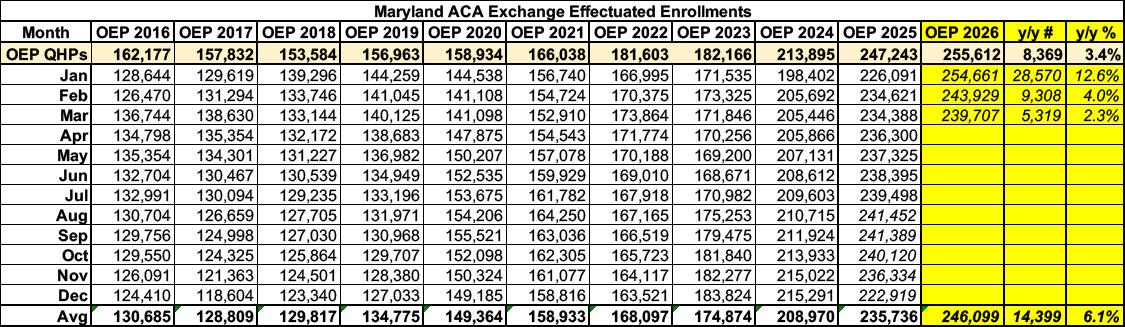
Maryland is one of the ten states in which Qualified Health Plan (QHP) selections during Open Enrollment actually increased year over year (by 3.4%).
Unlike the other five states I've written updates about so far, however, Maryland is unique in that it's the first state I've seen in which the year over year increase has grown a bit over time...at least as of March, anyway. Effectuated enrollment was 12.6% higher in January, 4% higher in February and 2.3% higher in March, for a Q1 average effectuated enrollment 6.1% higher than Q1 of 2025:
There's a pretty obvious reason for this--or at least for most of it: Maryland is fully backfilling 100% of the expired federal tax credits for all enrollees earning 100 - 200% FPL (which make up over 50% of total enrollees), and 50% of the expired credits for enrollees who earn 200 - 400% FPL (another 33% of all enrollees). Overall, that's roughly ~60% of all lost federal subsidies which the state is making good on.
Even so, it's still a bit surprising that effectuated enrollment is higher year over year (although that seems to be shrinking over time); there was a substantial loss of enrollees below the 100% FPL threshold (due primarily to recent documented immigrants no longer being eligible for any tax credits at all), yet enrollment at nearly every other income bracket increased, in some cases substantially.
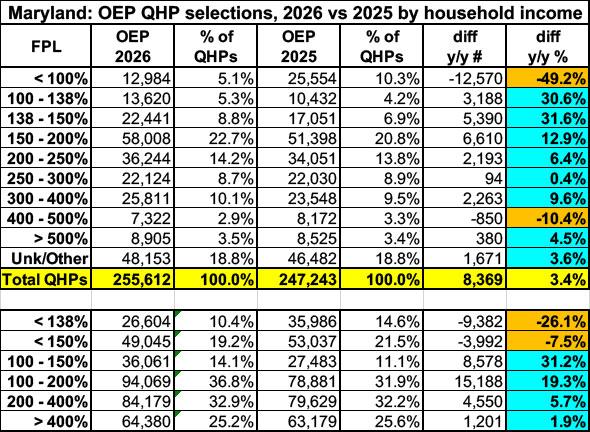
the exception is enrollees earning 400 - 500% FPL, who of course are also no longer eligible for any federal tax credits whatsoever.
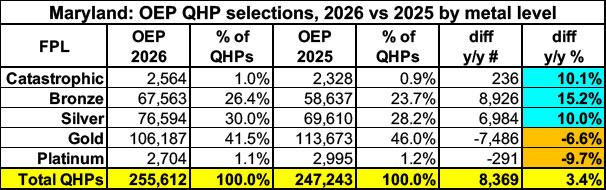
On the other hand, while overall enrollment has increased in Maryland, the quality of that coverage has dropped: Enrollment in more comprehensive Gold & Platinum plans has dropped from 47.2% of all enrollment to 42.6%) while enrollment in high-deductible Catastrophic & Bronze plans has increased from 24.6% to 27.4% of the total.
Silver plans have also gone up by 10%, although I don't have the breakout of CSR enrollment for Maryland so I don't know how much of these are "Secret Platinum" plans (which are actually better than Gold) vs. standard/CSR 73 Silver.
This News from the States article provides some additional insight about Maryland enrollment:
As fewer Marylanders qualify for federal tax breaks that used to keep health care costs down, state officials report that higher monthly premiums have led thousands to opt for lower-coverage healthcare plans than in previous years.
Approximately 8,000 Marylanders who previously selected gold plan coverage opted to take on a bronze plan this year, according to healthcare officials. That’s higher than the previous estimate initially reported to lawmakers in January of roughly 5,000 people downgrading their plans.
...Fabian-Marks says that the decrease in gold plans in favor of bronze is because some 190,000 Marylanders no longer receive the popular federal tax credits that previously brought down the costs of monthly premiums for those who purchased individual plans on the state’s Affordable Care Act marketplace.
The end of the federal tax credit in December had ripple effects on the whole healthcare economy. Last year, state insurance officials approved an average 13.4% premium rate increase for 2026 health care plans, to compensate for the expected drop in enrollment.
...According to March data from the exchange, bronze plan enrollment is up this year by 13%, while enrollment for gold plans is down 9%.
...Fabian-Marks said that only about 6,000 people who renewed coverage this year did not pay the January premium, which is not a significant increase from previous years.
In any event...What might this look like for the rest of the year?
Well, here's a visual version of the graph above, with the dotted lines respresenting what the rest of 2026 will look like if the effectuation pattern for the balance of the year follows either last year (2025) or the last pre-COVID year (2019):
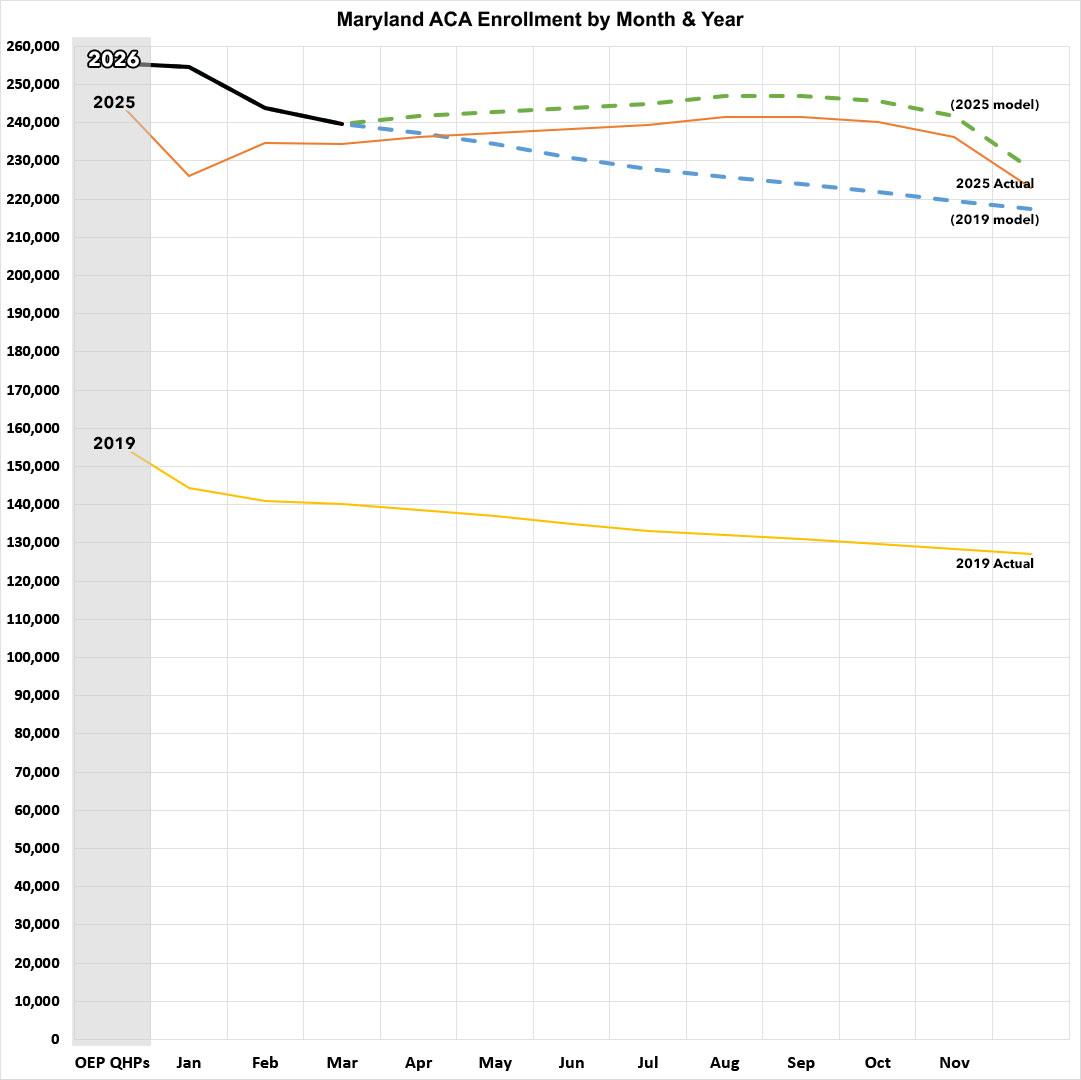
- If the rest of the year follows the 2025 pattern, effectuations will end December at around 227,000 and will average around 243,000 for the year...up 3.2% compared to 2025.
- If the rest of the year follows the 2019 pattern, effectuations will be at around 217,000 by December, and the average for the year will be around 231,000...down just 1.8% y/y.
Advertisement